Distance and average speed from a v(t) graph
The figure shows the graph of the velocity of a car versus time (velocity in m/s, time in seconds). Find the acceleration of the car on each stage of the motion, the distance travelled and the average speed over the whole motion.
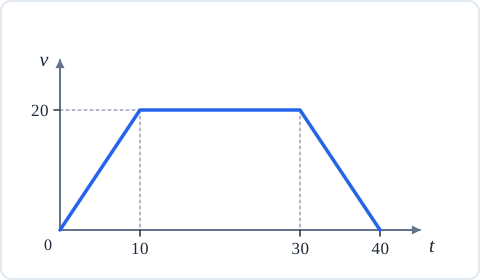
- 0–10 s: $v$ grows from 0 to 20 m/s
- 10–30 s: $v = 20$ m/s
- 30–40 s: $v$ falls from 20 to 0 m/s
- $a_1, a_2, a_3 = ?$, $s = ?$, $\langle v \rangle = ?$
The acceleration on a stage is the slope of the graph, $a = \Delta v / \Delta t$, and the distance travelled is numerically equal to the area under the velocity graph.
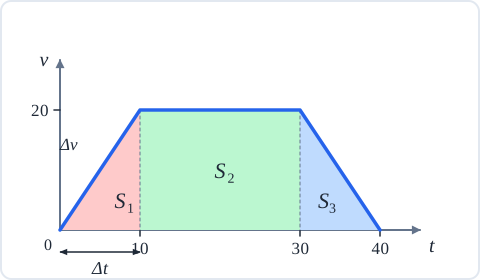
1. Accelerations. On the stage 0–10 s:
$$a_1 = \frac{20 - 0}{10} = 2 \text{ m/s}^2$$on the stage 10–30 s the velocity is constant, $a_2 = 0$; on the stage 30–40 s (braking):
$$a_3 = \frac{0 - 20}{10} = -2 \text{ m/s}^2$$2. The distance is the sum of the areas $S_1$ (triangle), $S_2$ (rectangle) and $S_3$ (triangle):
$$S_1 = \frac{1}{2} \cdot 10 \cdot 20 = 100 \text{ m}, \quad S_2 = 20 \cdot 20 = 400 \text{ m}, \quad S_3 = \frac{1}{2} \cdot 10 \cdot 20 = 100 \text{ m}$$$$s = S_1 + S_2 + S_3 = 600 \text{ m}$$3. The average speed is the total distance divided by the total time:
$$\langle v \rangle = \frac{s}{t} = \frac{600}{40} = 15 \text{ m/s}$$$a_1 = 2$ m/s², $a_2 = 0$, $a_3 = -2$ m/s²; $s = 600$ m; $\langle v \rangle = 15$ m/s
-
Average speed of a car
Easy
-
A car accelerates from rest at 2 m/s². Find the distance covered in 10 seconds
Easy
-
A body is thrown vertically upward at 20 m/s. Find the maximum height
Easy
-
A stone is thrown horizontally at 10 m/s from a height of 20 m. Find the range
Easy
-
A body is thrown at 30° to the horizontal at 15 m/s. Find the range
Medium
-
A shell leaves a cannon at 45° at 100 m/s. Find the maximum height and flight time
Medium