Emission and Absorption Spectra. Spectral Analysis
Send light from a lamp, a gas-discharge tube or a laser through a prism and compare the three kinds of spectra: continuous, emission line and absorption. See for yourself that a gas absorbs exactly the colours it emits, and then, like a real spectroscopist, identify the composition of an unknown gas and of the Sun from their lines.
Choose a light source and a substance. Hover over the spectrum — the magnifier shows a ±5 nm window with the tabulated lines. In “Laser + gas” mode click the graph or press “Scan” to find the absorption lines.
| λ, | hν, | I |
|---|
Line wavelengths are tabulated (NIST, in air). The natural line width is enlarged to 0.15 nm for clarity; the real one is thousandths of a nm. The lamp radiates as a black body at 3400 K. The gas in the cell absorbs exactly the wavelengths it emits itself at the same temperature (Kirchhoff’s law). The photons in the scene are an illustration: in “Lamp + gas” mode photons of resonant wavelengths are shown more often than in real light, otherwise the absorption would be almost invisible.
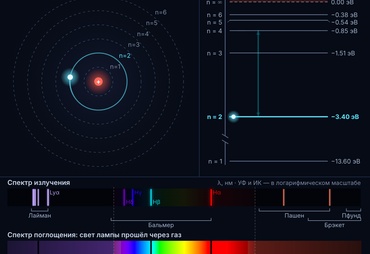
A hot solid gives a continuous spectrum — a rainbow without gaps. A rarefied glowing gas emits only separate wavelengths: each line is a photon with energy hν = Eₖ − Eₙ equal to the difference between two atomic levels. When white light passes through a cooler gas, the atoms take photons of those same energies out of it, and dark lines appear on the rainbow. Every element has its own set of lines, so a spectrum works like a fingerprint: it reveals the composition of substances, stars and distant galaxies.
KEY FORMULAS
Photon energy of a spectral line
Each spectral line consists of photons of one energy, born when the atom goes from level Eₖ to level Eₙ (emission) or absorbed in the reverse transition
Kirchhoff’s law of radiation
The ratio of a body’s emissive power r_λ to its absorptivity a_λ does not depend on the nature of the body and equals the emissive power of a black body r⁰_λ at the same temperature
The Beer–Lambert law
The intensity of light passing through a layer of thickness l decreases exponentially; k_λ is the absorption coefficient and τ_λ is the optical depth of the layer at wavelength λ
Resolving power of a spectral instrument
Δλ is the smallest wavelength difference between two lines that the instrument still shows as separate; the larger R, the closer the lines it can distinguish
When light passes through a prism, the prism spreads it out by wavelength — producing a spectrum. What the spectrum looks like depends on what emits the light. A hot solid or a dense gas (the filament of an incandescent lamp, molten metal, the surface of the Sun) gives a continuous spectrum: it contains all wavelengths, and the colours blend smoothly into one another. A rarefied gas, whose atoms hardly interact with each other, glows differently: its spectrum consists of separate coloured lines on a dark background. This is an emission line spectrum. Each line corresponds to an electron in the atom moving from level Eₖ to level Eₙ, and the photon carries away the energy hν = Eₖ − Eₙ. Because an atom’s energy levels are discrete, so are the wavelengths.
The third kind is the absorption spectrum. Let white light from a lamp pass through a cell of gas: the gas atoms absorb photons whose energy matches the energy of their transitions, and dark lines appear on the continuous spectrum. In 1859 Gustav Kirchhoff established that a gas absorbs light of exactly the wavelengths it emits itself at the same temperature. The simulator shows this at once: switch the source from “Gas tube” to “Lamp + gas” without changing the substance, and the bright lines turn into dark ones at the same places. Why is the line dark if the atom later emits the absorbed photon again? Because it re-emits it in a random direction, and only a tiny fraction goes towards the spectroscope. Watch the cell: absorbed photons fly off in all directions.
The “Laser + gas” mode shows absorption at the level of single photons. A laser emits light of a single wavelength. As long as the photon energy matches none of the atom’s transitions, the gas is transparent and the detector shows T = 100 %. But tune the laser exactly to a line (for example, to the yellow sodium line at 589.0 nm) and the atoms start absorbing the photons and re-emitting them in all directions — the cell glows, and the detector registers a dip in transmission. The “Scan” button sweeps the laser across the whole visible range and plots the transmission T(λ) — this is the absorption spectrum taken point by point, as in real laser spectrometers.
Kirchhoff and the chemist Robert Bunsen turned this discovery into a method — spectral analysis. It turned out that the spectrum of every chemical element is unique: sodium gives itself away with the bright yellow doublet at 589.0 and 589.6 nm, hydrogen with the red line at 656 nm, mercury with the green 546 nm and blue 436 nm lines, and neon with dozens of red-orange lines. As early as 1860–1861 Bunsen and Kirchhoff discovered caesium and rubidium from new spectral lines. And in 1868 a yellow line at 587.6 nm, belonging to no known substance, was found in the spectrum of solar prominences — that is how helium was discovered, 27 years before it was isolated on Earth. Test yourself in “Spectral analysis” mode: identify the composition of an unknown gas mixture by ticking substances and comparing their reference spectra with the sample.
The spectrum of the Sun is a continuous spectrum crossed by hundreds of dark lines, described in detail by Joseph von Fraunhofer in 1814. They are produced by atoms of the cooler solar atmosphere absorbing light from the hot surface. From these lines it was established that the Sun contains hydrogen, sodium, magnesium, calcium and iron. But not all the lines are solar: the oxygen O₂ bands at 687 and 759 nm are formed in the Earth’s atmosphere. Today spectral analysis is used everywhere, from checking the composition of steel and testing water to forensics and the search for atmospheres on exoplanets. Also notice the “Slit” slider: the narrower the spectroscope slit, the better it separates close lines. Choose sodium, narrow the slit and move the magnifier to 589 nm — one yellow line will split into two.
First come simulators and problems from this very chapter, then closely related topics of the section.
 Same topic
 Same topic
 Quantum Physics · Photoelectric Effect
 Quantum Physics · Thermal Radiation
 Quantum Physics · Radioactivity
 Mechanics · Motion
Section: Quantum Physics
All problems in this section (2)